The data flow is where the model-builder is required to determine the flow of data from the data source to the destination. Here you'll choose your data sources from where the dataset will be copied. You'll select which tables and columns to copy, and apply any required manipulations, calculations or scripting. And you'll choose a target server where the dataset will be loaded and stored.
The Data Flow interface is comprised of several toolsets required for constructing and designing the data flow from the source to the target or destination.
Interface Components
Data Flow Ribbon
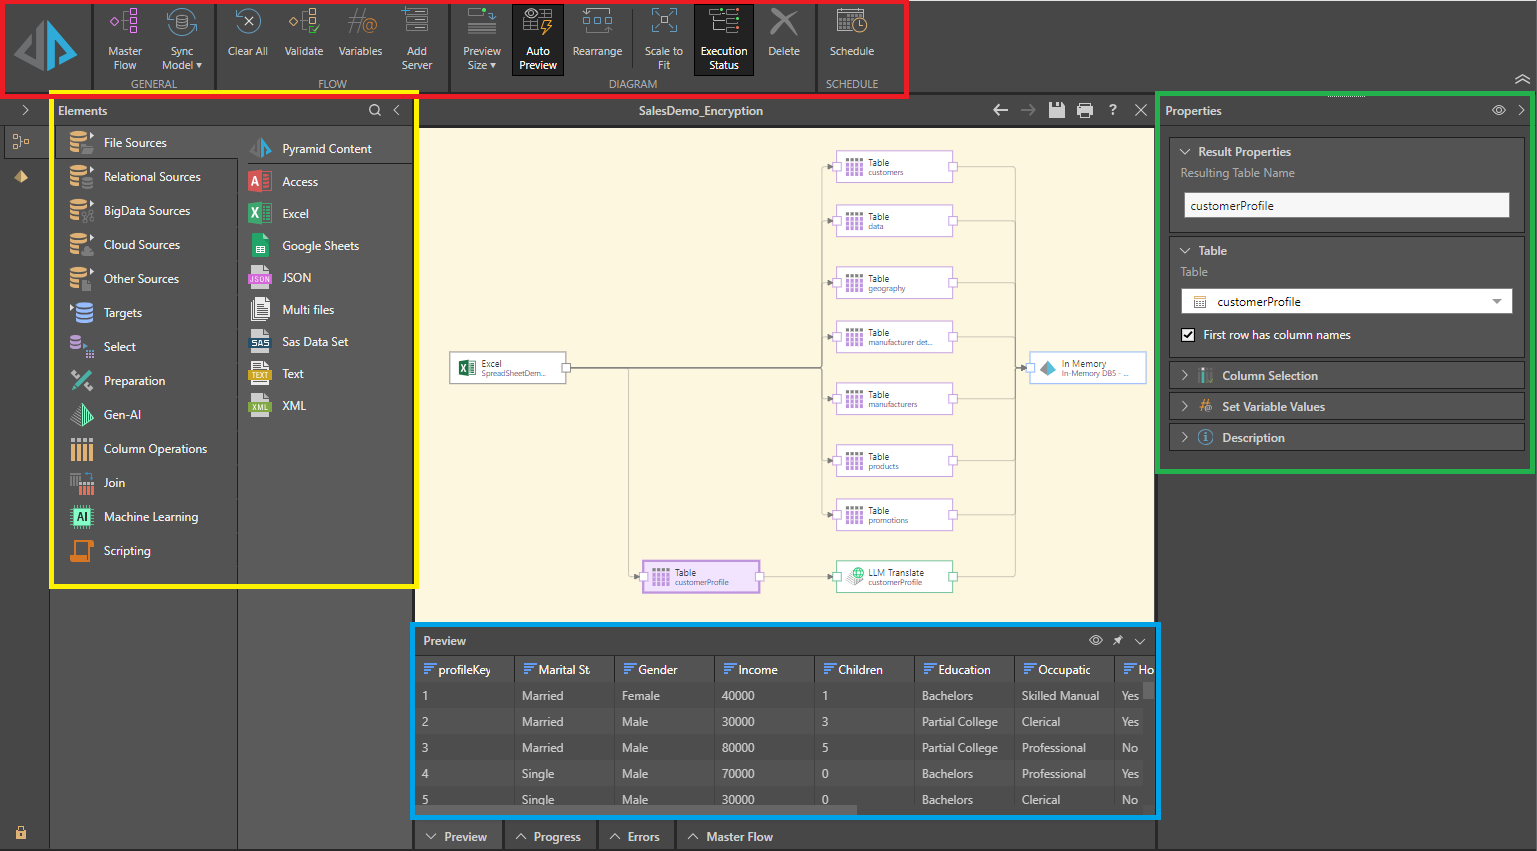
The data flow ribbon (red highlight below) exposes a number of commonly-used tools, and allows you to enable, disable, or customize certain data flow tools like the preview panel and execution status.
- Click here for details of the tools in the Data Flow ribbon.
Data Flow Canvas
The canvas is located in the middle of the interface; this is where the data flow diagram is constructed. The data flow is built by adding the required nodes from the Elements panel on the left (yellow highlight below) to the canvas, and connecting them in a logical way.
Elements
The Elements panel (yellow highlight above) features several tabs, each of which exposes a different selection of tools. The require tool or function is added to the flow diagram by dragging it from the Elements panel and dropping it onto the canvas. It must then be connected to the relevant nodes in the dialog; for instance, a filter node should be connected to the table containing the column to be filtered. Each node added to the flow diagram must be configured from its Properties panel (see below).
The Elements panel is comprised of the following tool sets:
- Sources: open one of the sources tabs to find and select the required data source from which you will copy your data set into Pyramid.
- Targets: connect the required destination server to the data flow diagram. This is the server on which the new Pyramid data model will be stored.
- Select: import tables from your data source. You can import multiple tables or a single table, write a custom SQL query that will determine which tables are imported, or import the top or bottom n number of rows from selected tables.
- Preparation: after importing tables, prepare the data set for querying by sorting and filtering columns, adding date/ time columns, generating latitude and longitude columns, and more.
- Gen-AI: after importing tables, transform your data using Generative AI / an LLM to automatically translate data, asses the sentiment contained by data, and transform data in response to your own natural language prompts (general).
- Column Operations: manipulate columns in the data flow; generate new columns based on a custom calculation, combine or split columns, change column aggregation, and more.
- Join: add horizontal or vertical joins to the data flow in order to join tables in the new database.
- Machine Learning: add machine learning algorithms to the data flow in order to find new patterns and information buried in your data.
- Scripting: add scripts to manipulate data during the ETL; you can download scripts from the Marketplace in a range or languages, or write your own script in Python or R.
Properties
The Properties panel (green highlight above) shows the properties of the selected node. Each node is configured using the options in the Properties panel, the contents of which varies depending on the type of node selected. For example, when a data source node is selected, its tables are displayed; when a table node is selected, its columns are displayed.
The Properties panel can be pinned or unpinned as required.
Preview
The Preview panel (blue highlight) displays a preview of the first 50 rows in the currently selected node. You can see a preview for a given table node (that is, a node representing a table copied from the data source), and select, preparation, column operation, join, machine learning, and scripting nodes.
Progress
The progress panel displays the progress of the execution when the new data model is being processed.
Errors
Any errors will be listed in the Errors panel. For example, if a node hasn't been configured properly, or the model processing execution fails, the errors will appear here.
Master Flow
The Master Flow panel shows the current master flow as a diagram. This shows where the data flow is in relation to the master flow. The master flow can contain multiple data flows and models, and advanced instructions for how and when to run them.